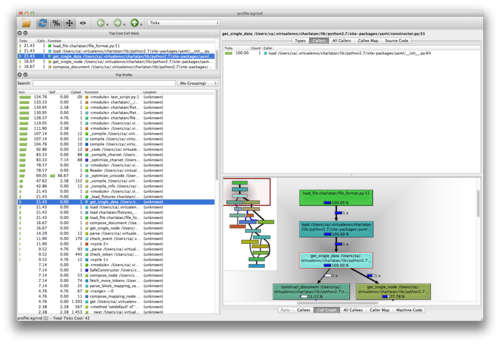
Using qcachegrind to visualize Python profiling data
code
Charles-Axel Dein
Dependencies
graphviz is required for the call graph.
$ brew install qcachegrind graphviz
$ pip install pyprof2calltree
Profiling
Profile your code with cProfile or Profile. pyprof2calltree won't work with hotshot. Store the profile data in a .pstats file.
$ python -m cProfile -o profile.pstats yourscript.py
Then run:
$ pyprof2calltree -i profile.pstats -o profile.kgrind
Then open this kgrind file with qcachegrind:
$ qcachegrind profile.kgrind
